Map Visualization
-
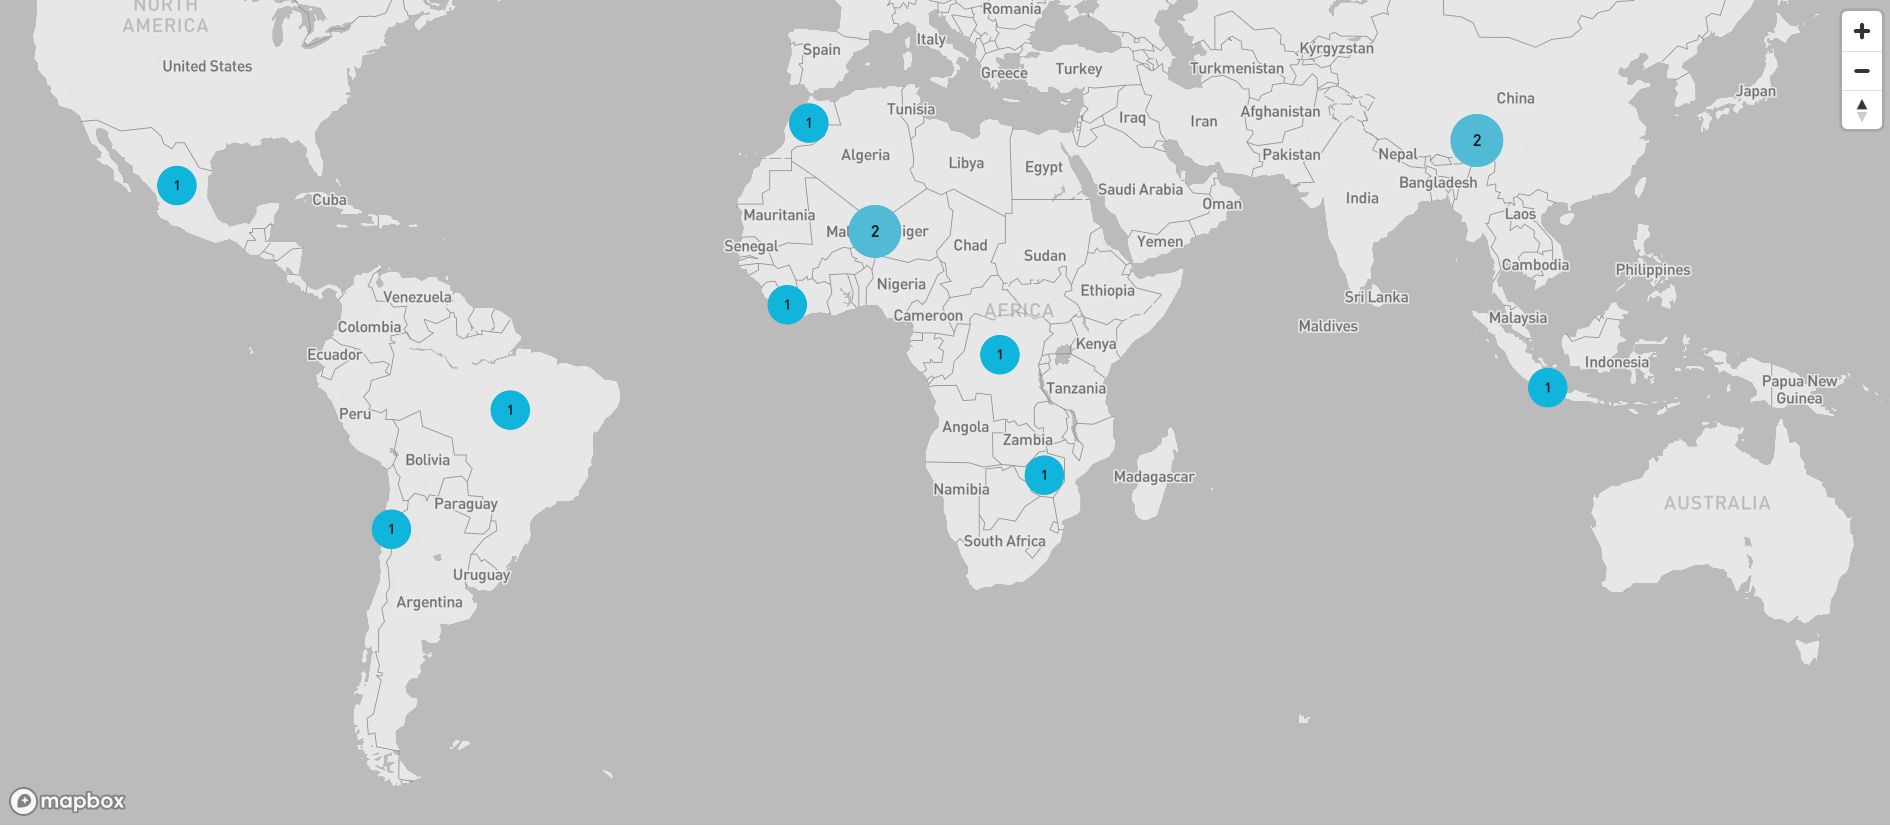
Visualizing dataset on Maps: Instructions for visualizing data on maps.
-
To visualize the map, navigate to the homepage and click on any pointer to zoom in. Pointers on the map are country-specific, allowing you to focus on data points within specific countries or regions.
-
Locate the zoom icon on the map interface. It is found in the top right corner.
-
Click the '+' icon to zoom in and the '-' icon to zoom out.
-
Alternatively, you can use the mouse scroll wheel to zoom in and out.
-
Click on individual data points to view detailed information about each data entry
-